🚕 NYC Taxi Trip Duration & Late Risk Prediction 🚕
Unstructured Data · Web Scraping · Computer Vision · Text Analytics · Classification
Project Type: Regression + Classification (Tabular ML)
Tools: Python, Pandas, Scikit-Learn, XGBoost, CatBoost, Matplotlib/Seaborn
Data: NYC Yellow Taxi Trip Records (Aug 2025) + TLC Taxi Zone Lookup
Outputs: Trip-time predictor + late-risk classifier + buffer-time guidance
Project Overview
Airport travel in NYC is a classic “planning under uncertainty” problem: if you leave at the typical time you might be fine, or you might hit a traffic spike and miss your flight. A single ETA can be misleading because it hides the late-risk tail — the unusually slow trips that matter most when you’re catching a flight.
This project builds an applied machine learning pipeline to answer two practical questions for Manhattan → JFK/LGA rides:
-
How long will the trip take? (regression — predicted minutes)
-
What is the probability the trip will be “late” relative to typical conditions? (classification — late-risk probability)
The goal isn’t just accuracy, it’s turning historical taxi data into usable departure-time guidance, and showing how different stakeholders (travelers vs ops teams) should choose different decision thresholds based on the cost of false alarms vs missed delays

Trip durations spike during rush hour; JFK trips are longer and more variable than LGA.

Late Rate varies throughout the day, increasing during rush hour
Business Question
How can we use historical NYC taxi data to predict airport trip duration and quantify late-risk so travelers and operators can make better departure-time and buffer decisions?
Data & Problem Setup
Data Sources
-
NYC Yellow Taxi Trip Records (Aug 2025): ~886K rows with pickup/dropoff timestamps, trip distance, payment type, and taxi zone IDs
-
TLC Taxi Zone Lookup: maps taxi zone IDs → neighborhood / borough names
Filtering & Cleaning (Realistic “Airport Ride” Slice)
To keep the modeling setting realistic and interpretable, we narrowed the scope to a single high-value use case: airport-bound rides.
-
Kept only trips starting in Manhattan
-
Kept only trips ending at JFK or LaGuardia
-
Converted timestamps → datetimes, computed trip duration (minutes)
-
Removed missing values and implausible trips (e.g., duration < 3 minutes, duration > 180 minutes, extreme distances)
After filtering and cleaning we reduced our dataset to ~50K clean Manhattan→airport trips. This keeps real-world variability while removing noise and measurement error that would distort the learning process.
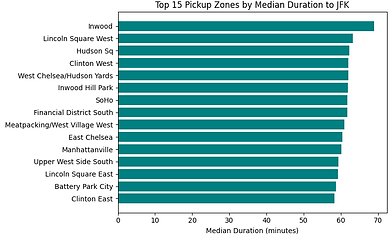
Airport demand and late risk are concentrated in Midtown/East Side pickup zones.

Airport demand and late risk are concentrated in Midtown/East Side pickup zones.
Feature Engineering (Pre-Trip Only)
Core pre-trip features
-
Pickup zone / neighborhood (spatial context)
-
Airport destination (JFK vs LGA)
-
Pickup hour + day of week (temporal traffic patterns)
-
Trip distance
-
Payment type
-
Rush-hour indicator (peak vs off-peak)
Leakage avoided on purpose
We explicitly excluded variables like fares, tolls, totals, and any “post-trip” info because they are either:
-
direct functions of trip duration,
-
or only known after the ride finishes
Including them would artificially inflate performance and make the model unrealistic in production.
Train/Test Strategy (Time-Based) + Baseline
Time-Based Split
Trips were sorted chronologically:
-
Earliest 80% → training (fit + tune models)
-
Most recent 20% → test (final evaluation only)
Strong Baseline: Median Lookup
Before using ML, we created a tough benchmark that many “real systems” resemble:
-
Predict duration using the historical median for each pickup zone × airport × hour group.
Baseline performance
-
MAE ≈ 13.1 minutes
-
RMSE ≈ 16.3 minutes
Even this simple lookup is fairly strong because it already captures key structure (location + airport + time-of-day). It also sets a meaningful bar: ML only matters if it materially improves on this baseline.
Regression Modeling: Predict Trip Duration (Minutes)
Models compared:
-
Linear Regression (simple parametric benchmark)
-
XGBoost Regressor (boosted trees; strong non-linear learning)
-
Random Forest Regressor (bagged trees; stable + interpretable)

What these numbers mean in practice
A ~5–6 minute MAE means that for a typical 45–60 minute JFK ride, the model’s error band is often within a “decision-relevant” range (ex: leave at 6:10 vs 6:30). It’s the difference between vague guidance and actionable “leave by” recommendations.
Why Random Forest was selected
XGBoost and Random Forest were very close on performance, but Random Forest was selected because it offered:
-
a small train–test gap (strong generalization)
-
smoother, more stable feature-importance patterns
-
easier explanation for non-technical stakeholders
What drives trip duration (interpretability)
Feature importance + EDA consistently show:
-
Hour of day dominates (rush hour effects)
-
Airport matters: JFK trips are longer and more variable than LGA
-
Trip distance matters but interacts with time and airport
-
Pickup zone and day-of-week add meaningful “neighborhood congestion” structure
Where it works best vs worst (credibility)
-
Best performance: shorter, more stable routes (e.g., Uptown → LGA), error can drop to ~3–4 minutes
-
Hardest cases: long + congested routes (e.g., Downtown → JFK during peak hours), where unobserved factors (weather/incidents) widen uncertainty

Predicted vs. actual trip durations on the test set, with most predictions closely tracking the ideal y = x line.

Feature importance from the Random Forest shows hour of day, airport, and trip distance as the strongest drivers of trip duration.
Classification Modeling: Predict Late Risk
Late Label (Relative, Context-Aware)
A trip is “late” if its duration is >120% of the typical median for similar trips (pickup zone × airport × hour × weekday). This targets the “unusually slow” tail, not just long trips.
Class Imbalance + Baseline (Why accuracy is misleading)
Only ~18% of trips are late, so a naïve model can achieve high accuracy while being useless. We used an “always on-time” classifier as a sanity check:
-
Accuracy ≈ 82%
-
F1 for late class = 0.0
So we evaluated models using:
-
Precision / Recall / F1 for the late class
-
ROC curve + Precision–Recall curve
Models Compared
-
Logistic Regression (interpretable, but conservative)
-
Random Forest (captures interactions)
-
CatBoost (final classifier)
Why CatBoost won
CatBoost performed best on:
-
ROC-AUC (~0.73)
-
Precision–Recall tradeoff (strong performance under class imbalance)
-
Late-class recall/F1 when paired with class weighting + threshold tuning
The key idea: the model needs to be good at catching late trips, not just being correct most of the time.


ROC curves: CatBoost has the highest AUC (~0.73), slightly outperforming Logistic and Random Forest.

Precision–Recall curves: CatBoost achieves the best precision–recall trade-off
Threshold Tuning: Traveler vs Ops (Turning ML into policy)
Instead of treating 0.50 as “the” cutoff, we framed late-risk prediction as a policy choice — the exact same model can behave differently depending on who it serves.
Traveler setting (high recall)
-
Threshold = 0.40
-
Recall ≈ 0.83, Precision ≈ 0.26
-
Prioritizes catching most late trips (“better safe than sorry”)
Ops / analytics setting (balanced)
-
Threshold = 0.50
-
Precision ≈ 0.30, Recall ≈ 0.66
-
Fewer false alarms, better for monitoring/reporting
This is a practical demonstration of “business-aligned ML”: you don’t retrain the model for every stakeholder — you tune the decision threshold around the cost of false negatives vs false positives.
Same model, different thresholds: travelers prioritize recall; ops prioritize balance

Buffer-Time Guidance (“Timing Advisor” Concept)
To translate probabilities into something a traveler can act on, we created a buffer curve for weekday Manhattan → JFK trips:
-
With 0 buffer, late risk is ~50% (median definition)
-
Adding 10–15 minutes roughly halves risk
-
Around 20–25 minutes buffer, late risk drops to low single digits — even in peak periods
This became the core product idea:
Airport Taxi Timing Advisor:
Given pickup zone + airport + departure time, estimate duration and recommend a buffer that keeps late-risk within the user’s comfort level (risk-averse vs risk-tolerant).
This bridges the gap between “model output” and “decision tool.”
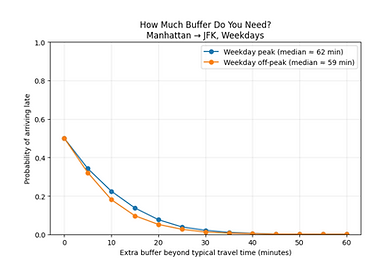
Adding 20–25 minutes buffer drops late risk to low single digits.

Late-risk is spatially concentrated; hotspot zones are targets for ops monitoring.
Key Insights
-
Airport + time-of-day dominate uncertainty: JFK routes are longer and more variable; rush hours create the widest spreads
-
Late risk is geographically concentrated: Midtown and East Side pickup zones contain high-volume + higher-risk patterns
-
ML adds real value beyond baselines: tree-based models reduce duration error from ~13 minutes → ~5–6 minutes and enable practical “leave by” guidance
-
Classification works best when treated as an imbalanced problem: metrics and thresholding matter more than overall accuracy
Takeaway
This project demonstrates an end-to-end applied ML workflow — and more importantly, how to convert predictions into a decision tool. Regression provides an ETA, classification exposes late-risk, and threshold + buffer selection converts both into actionable departure-time guidance for travelers and operational insight for stakeholders who care about on-time performance
Tools & Skills Demonstrated
-
Data Cleaning & Feature Engineering (Tabular / Time-Based Data)
-
Exploratory Data Analysis (EDA) & Visualization
-
Regression Modeling (Linear Regression, Random Forest, XGBoost)
-
Classification Modeling (Logistic Regression, Random Forest, CatBoost)
-
Ensemble Methods & Hyperparameter Tuning
-
Imbalanced Classification & Class Weighting
-
Model Evaluation (MAE, RMSE, R², ROC-AUC, Precision–Recall, F1)
-
Probability Threshold Tuning & Cost-Sensitive Decision Making
-
Feature Importance, Residual Analysis & Model Diagnostics
-
Translating Model Outputs into Actionable, Decision-Oriented Insights